Getting Started with Shape Cohort Generator
Before you start!
- This notebook assumes that shapeworks conda environment has been activated using
conda activate shapeworkson the terminal. - See Getting Started with Notebooks for information on setting up your environment and notebook shortcuts.
- See Getting Started with Meshes to learn how to load and visualize meshes.
- See Getting Started with Segmentations to learn how to load and visualize binary segmentations.
- Note example output was generated on Linux/Mac environment and may look different on Windows.
In this notebook, you will learn:
How to use the ShapeCohortGenerator package to generate meshes and segmentations (binary images) for synthetic shape cohorts, i.e., parameterized families of shapes.
About ShapeCohortGenerator
ShapeCohortGenerator is a python package that generates synthetic shape cohorts with groundtruth surface correspondences by varying different parameters describing such shape families.
What is a shape cohort ?
A shape cohort is a collection of geometric shapes that attain clear differences in shape; however, they share common characteristics that stem from the underlying mechanisms involved in their formation. For real-world shapes, e.g., anatomical structures, such common characteristics (or factor of variations) are not known in advance, hence ShapeWorks discovers such factors of variations directly from surface meshes or binary segmentations of such shapes. ShapeCohortGenerator uses the true factors of variations known for synthetic shapes that are analytically parameterized.
Why ShapeCohortGenerator?
We require a shape population dataset to run the shape modeling workflow. Each population dataset requires unique grooming steps. Developing and testing complicated grooming pipelines for large-scale datasets can consume a lot of computational resources and time. Hence, having a few toy datasets, which are lightweight and robust in variability can make this development and debugging process easier and simpler.These cohorts can also be used to test the optimization workflow.
What families of shape can be generated by ShapeCohortGenerator?
ShapeCohortGenerator currently supports two families of synthetic shapes, namely ellipsoids and supershapes.
Ellipsoids
An ellipsoidis symmetrical about three mutually perpendicular axes that intersect at the center. If a, b, and c are the principal semiaxes, the general equation of such an ellipsoid is $$\frac{x^2}{a^2} + \frac{y^2}{b^2} + \frac{z^2}{c^2} = 1$$
Supershapes
Supershapes are an extension of superellipses that can exhibit variable symmetry as well as asymmetry. Supershapes can be described through a single equation, the so-called superformula, that parametrizes a wide variety of shapes, including geometric primitives. The superformula is given by :
$$ r(\theta) = \left[ \left| \frac{1}{a} \cos \left( \frac{m\theta}{4} \right) \right|^{n_2} + \left| \frac{1}{b} \sin \left(\frac{m\theta}{4} \right) \right|^{n_3} \right]^{-\frac{1}{n_1}} $$
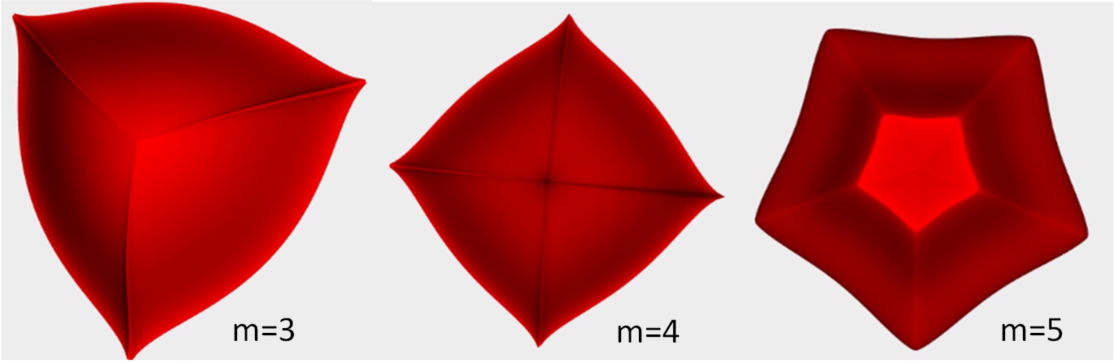
Unlike superellipses, supershapes need not to be symmetric; the parameter $m$ controls the rotational symmetry. The values of $a$ and $b$ control the size, and the exponents $n_1,n_2$ and $n_3$ control the curvature of the sides. The superformula can produce a wide range of shapes,including many shapes found in nature.
The ShapeCohortGenerator package allows the user to specify the rotational symmetry $m$ and the size. The values of $n_1,n_2$ and $n_3$ are randomly selected to creates shapes with different curvatures. Examples of these supershapes with different $m$ values can be seen below.
2D Supershapes
2D supershapes are the same as Supershapes but two-dimensional instead of three. When generation is called, contours are created rather than meshes When generate_segmentations and generate_images are called, 2D .png images are created rather than 3D .nrrd images.
Joint Ellipsoids
Joint ellipsoids are two ellipsoids positioned in a parameterized way in relation to each other. This cohort allows for exploring modes of variation such as relative rotation.
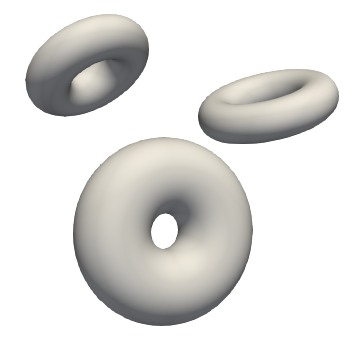
Torus
Tori are donut-shaped surfaces generated by a circle rotated about an axis in its plane that does not intersect the circle. For the tori mesh generation, the arguments are the same as for ellipsoids, except instead of randomize_x_radius and randomize_y_radius we have randomize_ring_radius (outside) and randomize_cross_section_radius(inside).
What you can do with ShapeCohortGenerator?
The ShapeCohortGenerator package can be used to generate collections of ellipsoids or supershapes, where the user can control the number of shapes in the cohort and the variability of the members of the cohort.
Each cohort will have mesh data (vtk format, supershapes will be saved in stl format) and segmentation image data (nrrd format). These cohorts generated by the package can be directly run with ShapeWorks. Generating these cohorts in the Output folder would be a good way to start.
We will also define modular/generic helper functions as we walk through these items to reuse functionalities without duplicating code.
Importing shapeworks library
import shapeworks as sw
Importing ShapeCohortGen library
To use this package, first a generator is defined, then generate() is called that generates shapes in vtk mesh format. Then segmentations (binary image) and images (synthetic intensities that mimic imaging data for real shapes) can be created from those meshes.
Each generator has three functions:
generate()for mesh generation (function specific to generator type)generate_segmentations()for segmentation generation based on meshes (general function shared by all generator types)generate_images()for image generation based on segmentations (general function shared by all generator types)
import ShapeCohortGen
Defining parameters for pyvista plotter
# define parameters that controls the plotter

# common for volumes and meshes visualization
notebook       = False # True will set the renderings inline
show_borders   = True  # show borders for each rendering window
show_axes      = True  # show a vtk axes widget for each rendering window
show_bounds    = True  # show volume bounding box
show_all_edges = True  # add an unlabeled and unticked box at the boundaries of plot.
font_size      = 10    # text font size for windows
link_views     = True  # link all rendering windows so that they share same camera and axes boundaries

# for volumes
shade_volumes  = True  # use shading when performing volume rendering
color_map       = 'coolwarm' # color map for volume rendering, e.g., 'bone', 'coolwarm', 'cool', 'viridis', 'magma'

# for meshes
meshes_color    = 'tan' # color to be used for meshes (can be a list with the same size as meshList if different colors are needed)
mesh_style      = 'surface' # visualization style of the mesh. style='surface', style='wireframe', style='points'.
show_mesh_edges = False  # show mesh edges
Generating an Ellipsoid Cohort
Step 1: Initalize Ellipsoid Generator
Here, we will initialize an ellipsoid cohort generator. The output directory needs to be specified, otherwise an output directory will automatically generated.
Arguments:
out_dir: path where the dataset should be saved
Datatype :string
Default value :current_directory/generated_ellipsoid_cohort/
out_dir             = "../Output/Generated_Ellipsoids/"
ellipsoid_generator = ShapeCohortGen.EllipsoidCohortGenerator(out_dir)
Step 2: Generate Meshes
For the ellipsoid mesh generation, you can specify the following arguments:
num_samples: number of samples in the cohort(dataset)
Datatype :int
Default value : 3
randomize_center: randomizes the centers for ellipsoid mesh generation if set toTrue
Datatype :bool
Defaut value :True
randomize_rotation: randomizes the orientation of the ellipsoid if set toTrue
Datatype :bool
Defaut value :Truerandomize_x_radius: randomizes the radius of the ellipsoid along x-axis if set toTrueor else the value is fixed as 20 for all ellipsoids
Datatype :bool
Defaut value :Truerandomize_y_radius: randomizes the radius of the ellipsoid along y-axis if set toTrueor else the value is fixed as 10 for all ellipsoids
Datatype :bool
Defaut value :Truerandomize_z_radius: randomizes the radius of the ellipsoid along z-axis if set toTrueor else the value is fixed as 10 for all ellipsoids
Datatype :bool
Defaut value :True
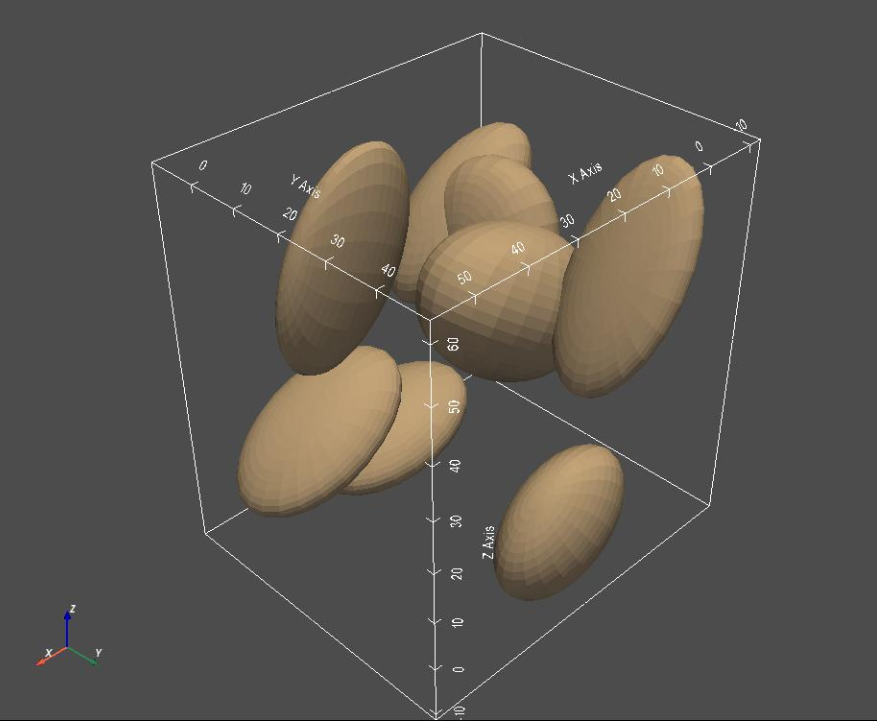
num_samples = 8
meshFiles   = ellipsoid_generator.generate(num_samples)
meshList = []
for i in range(len(meshFiles)):
    shapeMesh = sw.Mesh(meshFiles[i])
    meshList.append(shapeMesh)

# Plot the meshes
sw.plot_meshes(meshList, use_same_window=True, notebook=notebook)
Step 3: Generate Segmentations
For segmentation generation, you can specify the following arguments:
randomize_size: randomize the size of the images to include more background if set toTrue
Datatype :bool
Defaut value :Truespacing: set the spacing of the segmentation image
Datatype:list
Default value:[1,1,1]
allow_on_boundary: If set toTrue,randomly selects 20% samples and ensure that the shapes are touching two random selected axes out of[x,y,z]
Datatype :bool
Defaut value :True
segFiles = ellipsoid_generator.generate_segmentations()
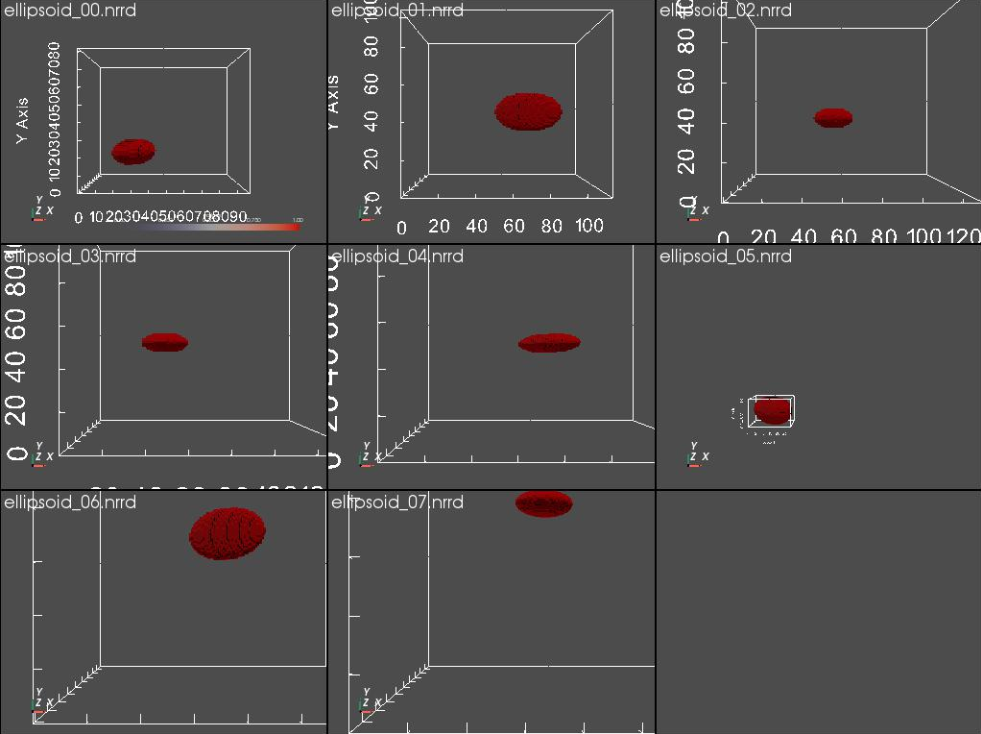
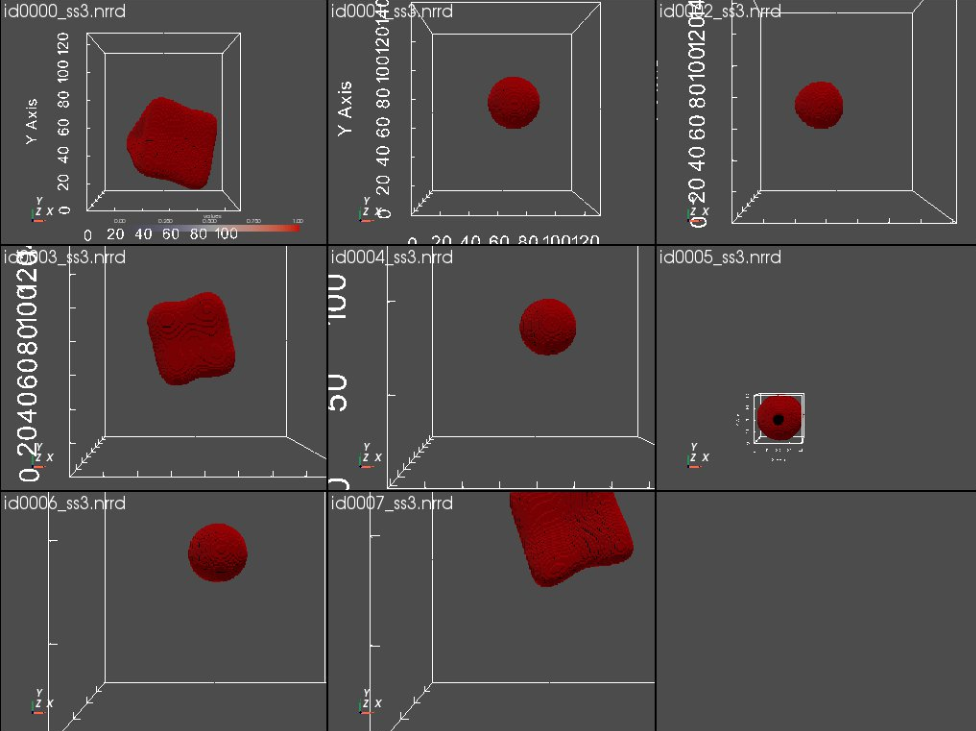
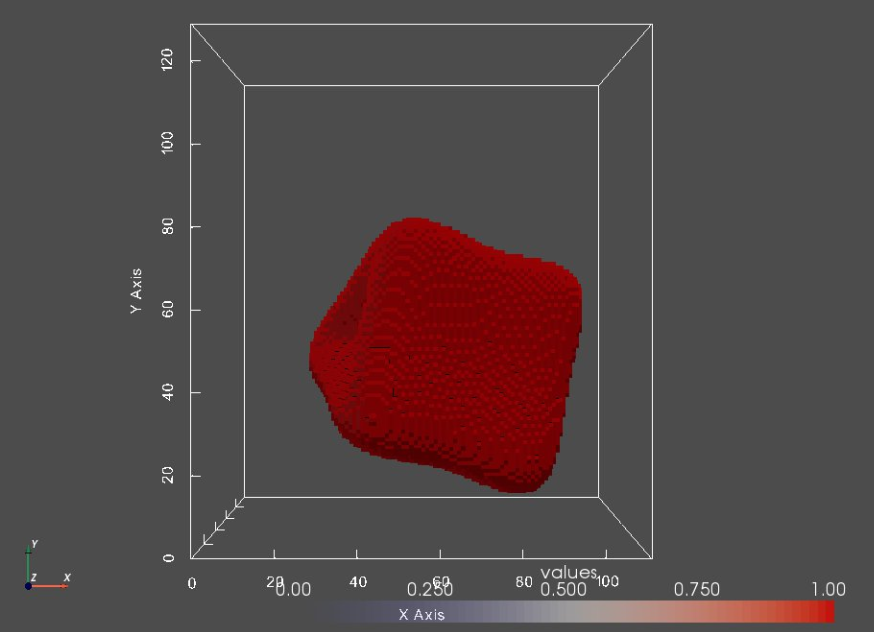
Let's visualize the generated segmentations.
shapeSegList = []
shapeNames   = []

for segFile in segFiles:
    shapeSegList.append(sw.Image(segFile))
    shapeNames.append(segFile.split('/')[-1])
print(shapeNames)

sw.plot_volumes(shapeSegList,
             volumeNames    = shapeNames,
             notebook       = notebook,
             show_borders   = show_borders,
             shade_volumes  = shade_volumes,
             show_axes      = show_axes,
             show_bounds    = show_bounds,
             show_all_edges = show_all_edges,
             font_size      = font_size,
             link_views     = True ) #link_views
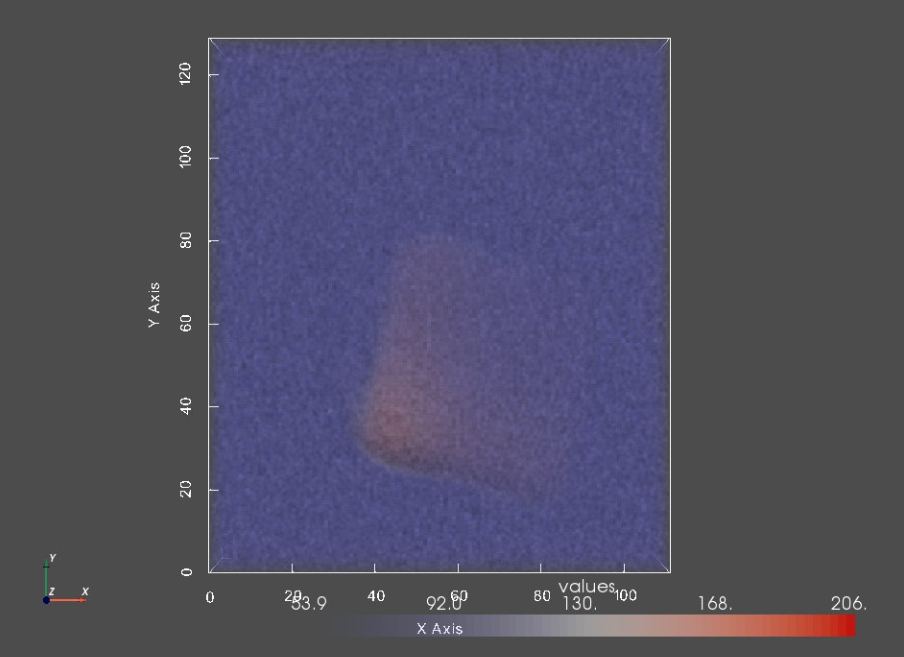
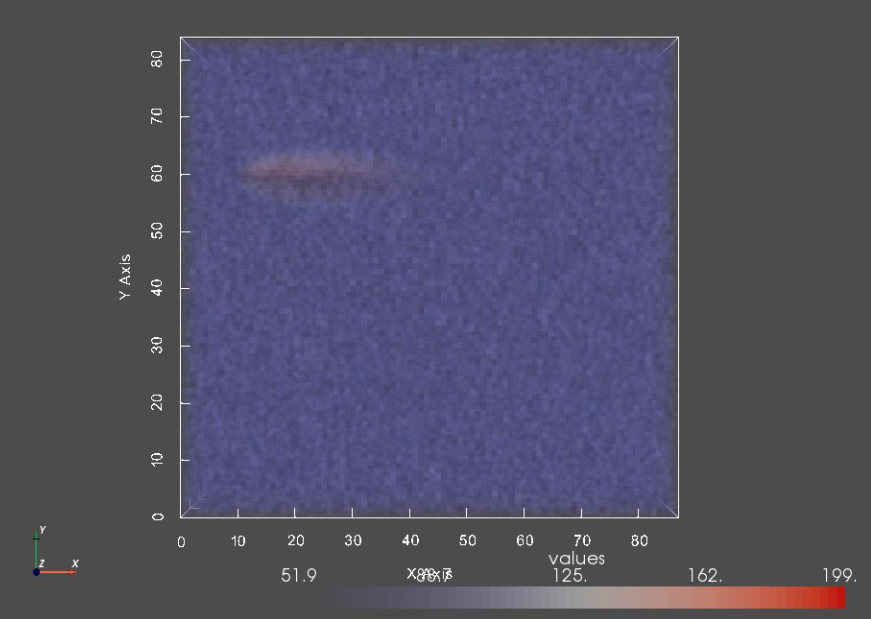
Step 4: Generate Images - Turning segmentations into non-binary images
For the image generation, a Gaussian distribution is used to define foreground and background pixels values and a blur factor is used to blur the boundary with a Gaussian filter. You can specify the following arguments:
blur_factor: size of Gaussian filter to use for boundary blurring
Datatype :int
Defaut value :1foreground_mean: mean of the foreground pixel value distribution
Datatype:int
Default value:180
foreground_var: variance of the foreground pixel value distribution
Datatype :int
Defaut value :30background_mean: mean of the background pixel value distribution
Datatype:int
Default value:80
background_var: variance of the foreground pixel value distribution
Datatype :int
Defaut value :30
imageFiles = ellipsoid_generator.generate_images()
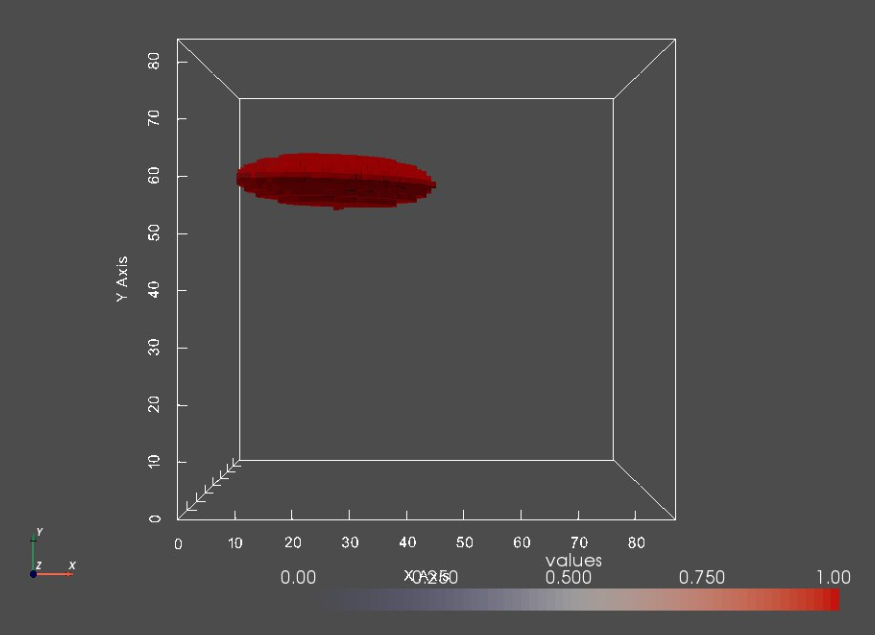
Let's compare a segmentation to it's corresponding image.
print("Segmentation:")
seg0 = sw.Image(segFiles[0])
sw.plot_volumes(seg0)
print("Image:")
img0 = sw.Image(imageFiles[0])
sw.plot_volumes(img0)
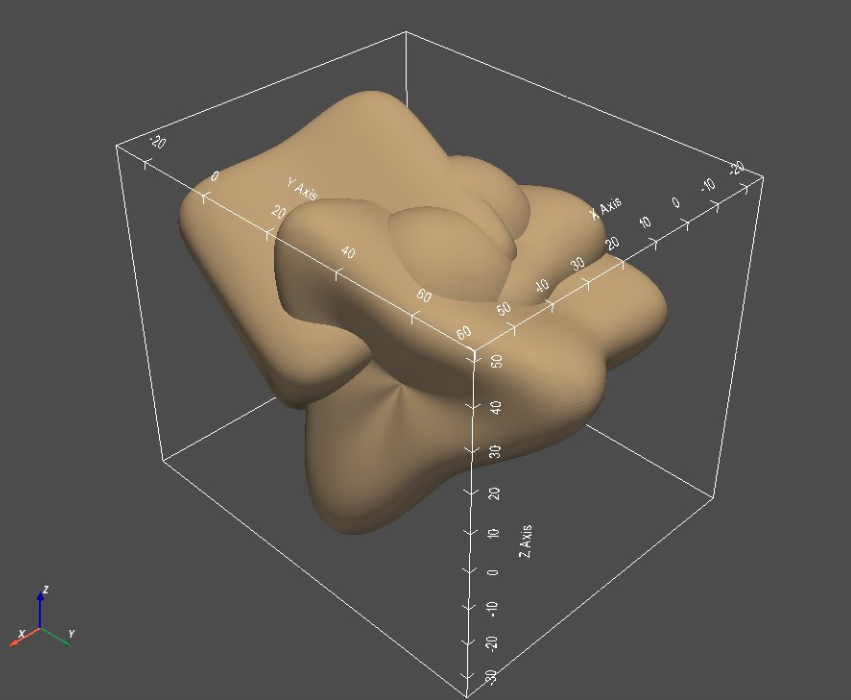
Generating Supershapes Cohort
SuperShapes are parameterized shapes that have geometry based on a given number of lobes, $m$.
Step 1: Initialize SuperShapes Generator
Here, we will initialize SuperShapes cohort generator. The output directory needs to be specified otherwise an output directory will automatically be generated.
Argument:
out_dir: path where the dataset should be saved
Datatype :string
Default value : 'current_directory/generated_supershapes_cohort/'
out_dir      = "../Output/Generated_Supershapes/"
ss_generator = ShapeCohortGen.SupershapesCohortGenerator(out_dir)
Step 2: Generate Meshes
For the supershapes mesh generation, you can specify the following arguments:
num_samples- number of samples in the cohort(dataset)
Datatype :int
Default value : 3
randomize_center: randomizes the centers for ellipsoid mesh generation if set toTrue
Datatype :bool
Defaut value :True
randomize_rotation: randomizes the orientation of the ellispoids if set toTrue
Datatype :bool
Defaut value :Truem: number of lobes supershapes should have
Datatype :int
Default value:3
size: size of meshes (won't be more than 'size' away from center in any direction)
Datatype:int
Default value:20
num_samples = 8
meshFiles   = ss_generator.generate(num_samples)
meshList = []
for i in range(len(meshFiles)):
    shapeMesh = sw.Mesh(meshFiles[i])
    meshList.append(shapeMesh)

# Plot the meshes
sw.plot_meshes(meshList, use_same_window=True, notebook=notebook)
Step 3: Generate Segmentations
This is data type independent, the options are the same as they were for the ellipsoid.
segFiles = ss_generator.generate_segmentations()
Let's visualize the generated segmentations.
shapeSegList = []
shapeNames = []

for segFile in segFiles:
    shapeSegList.append(sw.Image(segFile))
    shapeNames.append(segFile.split('/')[-1])
print(shapeNames)

sw.plot_volumes(shapeSegList,
             volumeNames    = shapeNames,
             notebook       = notebook,
             show_borders   = show_borders,
             shade_volumes  = shade_volumes,
             show_axes      = show_axes,
             show_bounds    = show_bounds,
             show_all_edges = show_all_edges,
             font_size      = font_size,
             link_views     = True ) #link_views)
Step 4: Generate Images
This is also a standard function and has all the same options as listed before.
imageFiles = ss_generator.generate_images()
Let's compare a segmentation to it's corresponding image.
print("Segmentation:")
seg0 = sw.Image(segFiles[0])
sw.plot_volumes(seg0, notebook=notebook)
print("Image:")
img0 = sw.Image(imageFiles[0])
sw.plot_volumes(img0, notebook=notebook)