Shapeworks Studio Usage Instructions
Web pages for Shapeworks Studio
View the Project on GitHub SCIInstitute/ShapeworksStudio

Table of Contents
Running Shapeworks Studio
Studio runs with no command-line arguments.
You Should have a Qt window that looks similar to the one below.
<img src=”https://sciinstitute.github.io/shapeworks.pages/images/Application.png” width=300px>
The application has tools on the left, the rendering window,
view options on the lower bar, a small file menu, and a
preferences dialog.
Data
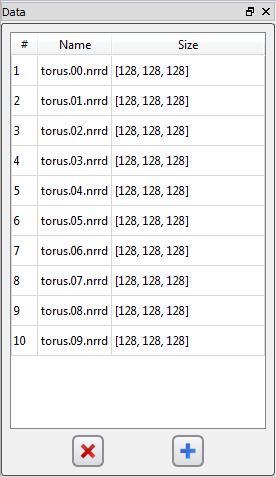 This tool tab displays the images (volume files in NRRD format) that have been loaded.
You can select the image files to load by either clicking the blue “+” button at the bottom,
or going to File -> Import Images…
This tool tab displays the images (volume files in NRRD format) that have been loaded.
You can select the image files to load by either clicking the blue “+” button at the bottom,
or going to File -> Import Images…
Your images will appear on the display once loaded.
You can delete images by selecting the image of choice and clicking the red “x” button at the bottom. If only one image
is loaded, it may still display when it is deleted. It will be replaced by the next image load.
Groom
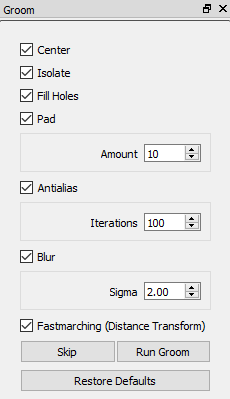 Once more than 1 image is loaded, the preprocessing step, “groom” is next. You can select several options for grooming.
Center This option attempts to allign the segmentations to a common center if they aren’t the same sizes.
Isolate This option isolates the foreground.
Fill Holes This option fills any existing holes in the segmentations.
Pad This option adds a padding around the shapes. This can help when a larger number of correspondance points are needed.
You can select what amount is appropriate for the optimization step.
Antialias This option antialiases the binary segmentation. You can select the number of antialias iterations.
Blur This option blurs the distance transform to get rid of high-frequency artifacts. You can choose an appropriate sigma
for the blurring.
Fastmarching This option computes a distance transform of the surface using the fastmarching method.
Run Groom Click this when you are ready for grooming. This step takes some time. Output is put into a
ShapeWorksStudioTools.log file next to the executable. A progress indicator shows the tool is working.
Skip Click this if you believe your data to already be pre-processed to your liking.
Restore Defaults Click this to restore all values to their program defaults.
Optimize
Optimize
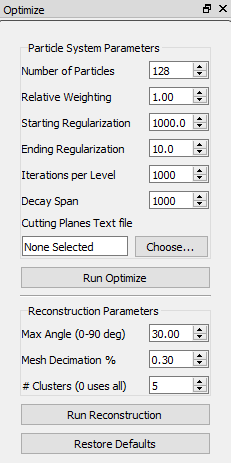 Once the grooming step is complete, you can run the optimize step. The Optimize table has 5 parameters per split.
Number of Particles Specifies the number of particles to be used to represent each shape in the ensemble.
Keep in mind that the actual particle count will be a power of “2” >= the provided number.
Relative Weighting The relative weighting of terms in the two-term cost function used for the optimization.
Starting/Ending Regularization These options determines the regularizations on the covariance matrix for the shape-space
entropy estimation.
Iterations per Level Specifies the number of iterations to run between successive particle splits during an
initialization phase. This allows the particle system at a given granularity to converge to a stable state
before more particles are added.
Decay Span The parameters RegStart, RegEnd, and DecaySpan define an “annealing” type optimization,
where the minimum variance starts at RegStart and exponentially decreases over DecaySpan to the
RegEnd value. This is usually the same number as iterations.
Run Optimize Click this when you are ready for optimizing. This step takes a while.
A progress indicator shows the tool is working.
Reconstruction
Max Angle This is the greatest angle between particle normals (from respective samples)
permitted to label the particle “good”, or useful for reconstruction.
Mesh Decimation The “PreView” library code can decimate the number of triangles to the value
set here. The default is “0.30” or 30 percent.
# Clusters To help speed up reconstruction, you can define how many samples/Clusters
are used to warp data into mean space. “0” indicates to use all of the samples.
Run Reconstruction Click this to run the reconstruction step. If it fails, the VTK
triangles are used instead. You can re-run with different Optimizations as needed.
Restore Defaults Click this to restore all values to their program defaults.
Analysis
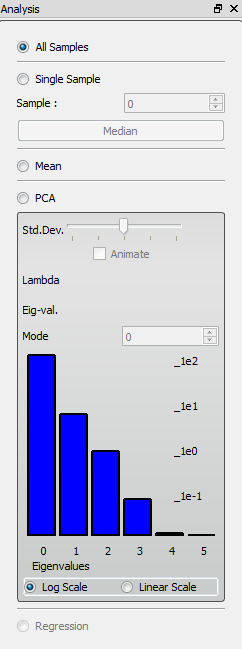 Here is where all the statistical options are available to the user.
All Samples Display all of the image segmentation samples on the screen.
Single Sample Display only one sample. You can select a particular number, or click “median” to display the shape
that is the computed median of all the shapes.
Mean Display the computed mean of the shapes.
PCA Display the computed shape from an eigen value and a standard deviation.
Std.Dev. Slide the slider back and forth to display the computed shape with various standard deviations.
Animate Check this box to watch the shape morph between various standard deviations automatically. Depending on
the machine running the application, the number of samples, and the size of the samples, the animation may be
slow at first while building and caching the meshes. You can select the caching, memory, and threading options
in the Preferences. Changing the number of neighbors, spacing, and smoothing options in preferences also affects
meshing time and quality.
Mode This selects the ordered eigen vector and eigen values from the statistical analysis. There are #samples - 1 modes.
The higher the mode, the less variance with the standard deviations. Usually the first two modes contain the most variance
between shapes.
Log Scale vs. Linear Scale The bar graph can be plotted in either log or linear scaling. The graph shows the eigen values
in decreasing values to depict statistical relevancy.
Regression This option is not yet available.
Rendering Window
The render window has a few shortcuts to viewing options.

From left to right, here are the rendering options.
Autoview Reset the view to fit the samples. This only affects zoom and translation.
Show Glyphs Toggle whether to show the glyphs for the coorespondence points.
Glyph Quality This slider changes the quality of the coorespondance points glyphs. This is sync’d with the render window
shortcut option.
Glyph Size This slider changes the size of the coorespondance points glyphs. This is sync’d with the render window
shortcut option.
Glyph options Click the down arrow to resize the glyphs or select the quality of the glyphs.
Show isosurface Toggle whether to view the surface representing the shape.
View mode drop-down This drop-down gives 3 options for view mode. Original is the binary segmentation. You must
have loaded images for this option to be available. Groomed is for the distance transform view. You must
run the groom step for this to be available. Reconstructed is for the calculated shape based on the set of
coorespondance points. You must run the optimize step for this to be available.
Center Center the samples automatically to align. This is useful if original samples aren’t the same size.
Zoom This slider allows the user to zoom in or out to view more/less samples. This is mainly useful in the “All Samples”
mode of the analysis tool. Zoom is automatically selected as a user switches between analysis modes.
Preferences
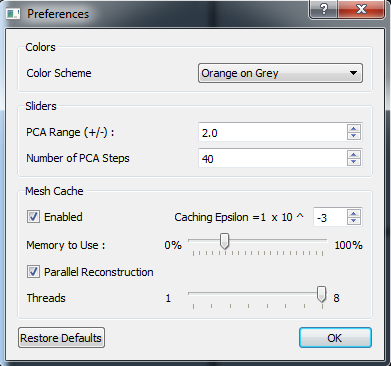 Color Scheme Select the color scheme for the rendering window.
PCA Range This is the amount of standard deviation to reach on the +/- ends of the PCA Slider.
Number of PCA Steps This determines how many steps between +/- PCA Range to take for visualization.
Enable Caching To speed up mesh animation, you can cache the meshes into system memory to load as needed.
Caching Epsilon How sensitive the caching is. The smaller the epsilon, the more meshes that will be cached, even if
they are very similar. If this is too high, large mesh differences might be ignored.
Memory to Use Select the amount of system memory to use for caching. Turn this down if your machine’s memory
is bogged down from the program.
Parallel Reconstruction Select the amount of threads to fire (up to system hardware core max) to run while
building meshes. This speeds reconstruction, theoretically.
Restore Defaults Click this to restore all options to the program’s default values. Options are saved and reloaded
between application runs for convenience.
OK Click this when you are done changing options.
File Menu
- Start a new project
- Open and save projects
- Set the data directory for where generated images will be written when a project is saved.
- Load new images
- Export a mesh reconstructed for samples, the mean, or a variance from the mean.
- Export the Eigen values or Eigen vectors from the sample statistics.
- Export the Particles per shape to text files.
- Export an XML parameter file to run a command line too on more images
- Open recent projects
- Quit the application.
Known Issues
- On OSX, full screen mode has a widget bug visualization problem for the left panel. Future Qt releases may fix this.
Contact and Bug Reports
Please email any questions to shapeworks-users@sci.utah.edu . If there problems or bugs, please report them using the issue tracker on GitHub. This includes feature requests. Feel free to add improvements using git pull requests.